Latent Class Trajectory Models in Clinical Research
Latent class trajectory models identify unobserved subgroups with similar longitudinal patterns. They can summarize heterogeneity in symptoms, biomarkers, adherence, or utilization, but classes are probabilistic model-based summaries, not directly observed diseases or guaranteed clinical phenotypes.
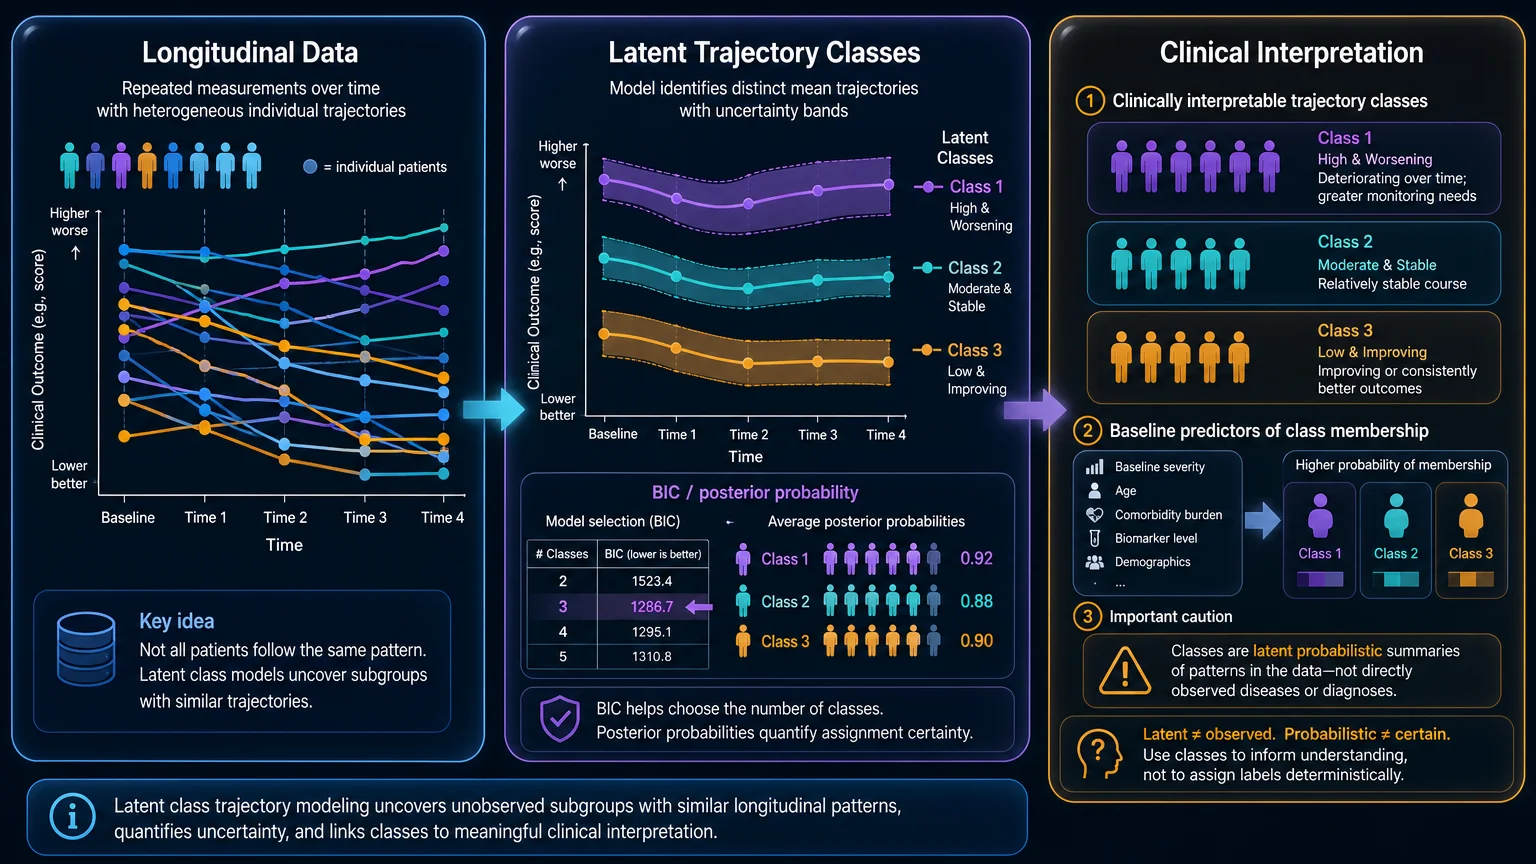
Clinical cohorts rarely follow one average path. Pain scores may improve quickly for one subgroup, remain stable for another, and worsen for a third. A biomarker can show early response, delayed response, or persistent elevation. Medication adherence can fluctuate rather than follow a single population mean. Latent class trajectory modeling provides a framework for describing such patterns by estimating a finite set of unobserved classes with distinct longitudinal trajectories.
The method is attractive because it turns repeated measurements into an individual-centered description of heterogeneity. It is also easy to overinterpret. The estimated classes depend on the selected outcome distribution, time scale, polynomial form, number of classes, missing-data assumptions, and sample size. A trajectory class is not automatically a biological subtype, a treatment target, or a causal mechanism.
What question does a trajectory model answer?
A trajectory analysis asks whether the observed longitudinal data are better described by several groups with different patterns over time than by a single population-average curve or a conventional random-effects model alone. The primary target is usually descriptive: identify clinically interpretable patterns and estimate the probability that participants belong to each pattern.
The question should be written before model fitting. Examples include:
- Do patients with chronic pain show distinct symptom courses during follow-up?
- Are there subgroups with different medication-adherence patterns after treatment initiation?
- Do biomarker trajectories identify groups with different subsequent risk?
- Does a behavioral or functional measure follow different developmental or recovery paths?
These are not interchangeable questions. A model describing latent patterns is different from a causal analysis of whether an exposure changes trajectory membership. If class membership is later used as a predictor of outcome, the analysis must account for classification uncertainty and avoid treating estimated labels as error-free observations.
GBTM, growth mixture modeling, and related approaches
| Approach | Core idea | Typical use | Important boundary |
|---|---|---|---|
| Group-based trajectory model (GBTM) | Uses a finite mixture of trajectory groups, often with one representative mean path per group. | Describing distinct longitudinal patterns in symptoms, behaviors, or utilization. | Within-class variation may be constrained; a class is a statistical approximation, not a literal homogeneous group. |
| Growth mixture model (GMM) | Combines latent classes with random effects so individuals can vary around class-specific trajectories. | Modeling heterogeneity both between classes and within classes. | More parameters can create instability, local maxima, weakly identified solutions, or sensitive class enumeration. |
| Latent transition analysis (LTA) | Models movement among latent statuses across discrete time points. | Studying transitions between symptom or risk states. | It is not identical to a continuous growth trajectory model; the measurement structure must match the research question. |
| Mixed-effects model | Models population-average and individual deviations without requiring discrete latent classes. | Estimating average change and continuous individual variation. | Continuous heterogeneity should not be forced into discrete classes without evidence. |
Terminology is inconsistent across applied literature. Some papers use “trajectory analysis,” “latent class growth analysis,” “group-based trajectory modeling,” and “growth mixture modeling” as if they were interchangeable. They are not fully interchangeable. The methods differ in whether within-class random effects are included, how the outcome distribution is specified, and how class membership uncertainty is handled.
Data structure and time scale
Trajectory models require repeated measurements aligned to a meaningful time scale. The time variable may be age, months since diagnosis, time since treatment initiation, days after discharge, or study visit. A clinically plausible time origin is more important than a convenient index. If participants enter at different disease stages, calendar time may obscure the process of interest.
At least several measurement occasions are usually needed to distinguish a trajectory from noise. Two observations per participant may describe change, but they provide limited information for estimating curvature or separating classes. More time points improve the opportunity to assess nonlinear patterns, although repeated measurements do not solve sparse outcome information or informative dropout.
The outcome distribution should follow the measurement scale. Continuous approximately Gaussian outcomes may use normal trajectories; counts may require Poisson or negative-binomial distributions; binary outcomes require a suitable link; bounded or censored outcomes require additional modeling decisions. A normal model for a highly skewed count or a bounded score can produce classes that reflect distributional misspecification rather than clinically meaningful patterns.
Choosing the trajectory shape
Within each class, the mean trajectory may be linear, quadratic, cubic, spline-based, or otherwise structured. Higher-order polynomials can fit complex curvature but may create implausible behavior at the boundaries and unstable extrapolation. A visually appealing curve is not sufficient evidence that the underlying clinical process has that shape.
Time should be centered and scaled when appropriate, especially when polynomial terms are included. Researchers should pre-specify a small set of plausible shapes, compare them using fit criteria and clinical diagnostics, and display the fitted curves over the observed data. The selected model should not be chosen solely by the lowest information criterion if it creates tiny classes, implausible turning points, or clinically uninterpretable patterns.
Class enumeration: how many classes?
Class enumeration is the process of deciding how many latent groups to retain. BIC, likelihood-based criteria, posterior probabilities, entropy, class size, stability across starting values, and clinical interpretability may all contribute. No single criterion determines the correct number of classes.
Adding classes almost always improves or preserves some measure of fit. That does not mean every additional class represents a real subgroup. Very small classes can be artifacts of outliers, non-normality, missingness, or an overly restrictive model. A class solution that changes substantially with starting values should be treated as unstable rather than presented as a settled discovery.
Researchers should report the candidate class counts considered, the information criteria, average posterior probabilities, class sizes, convergence checks, and the substantive reason for selecting the final solution. When the two-class and three-class solutions tell the same clinical story, the simpler model may be preferable. When a small additional class changes clinical interpretation, the decision should be justified and sensitivity analyses should be shown.
Posterior probabilities and classification uncertainty
Each participant receives posterior probabilities of membership across the estimated classes. The highest-probability class is often used for description, but it is not a directly observed label. A participant with probabilities of 0.52, 0.43, and 0.05 is not equivalent to a participant with probabilities of 0.98, 0.01, and 0.01.
Classification quality can be summarized by average posterior probabilities, classification error, and related diagnostics. If class membership is used in a subsequent regression, survival analysis, or causal model, a one-step “assign then analyze” approach can attenuate associations or create bias. Three-step approaches or probability-based procedures may better preserve uncertainty, depending on the software and estimand.
Class labels should also be named cautiously. “High-risk trajectory” describes the modeled pattern; it does not establish a biological disease subtype. “Non-responder” implies a treatment response definition and should not be used merely because a curve is relatively flat. Naming should follow the observed scale, time window, and model output.
Missing data, dropout, and informative observation
Longitudinal studies commonly have intermittent missing measurements and dropout. Full-information maximum likelihood or multiple imputation may be reasonable under assumptions about the missing-data mechanism, but the assumptions must be stated. If dropout depends on unobserved future outcome or latent trajectory membership, standard missing-at-random assumptions may be inadequate.
Trajectory classes can be especially sensitive to missingness because dropout may remove the participants most likely to worsen or improve. Compare observation patterns by baseline characteristics and early outcome values. Report the number and timing of measurements, reasons for dropout, follow-up completeness, and whether sensitivity analyses alter class definitions or downstream associations.
Informative observation schedules also matter. Patients with worsening symptoms may be measured more frequently, while stable patients may have fewer visits. A model that treats irregular observations as if they were scheduled identically can confuse healthcare utilization with disease trajectory. Joint models, inverse-intensity weighting, or other approaches may be relevant when observation processes are clearly informative.
Predictors of trajectory membership and downstream outcomes
After estimating trajectories, researchers often examine baseline predictors of class membership or compare later outcomes across classes. These analyses are useful but require careful ordering. Predictors should be defined before class membership when the goal is to explain who follows a trajectory. Variables measured after the trajectory begins may be mediators, consequences, or selection variables rather than baseline predictors.
For downstream outcome analyses, classification uncertainty should be carried forward. If the outcome is survival, a naive comparison of hard-assigned classes can exaggerate differences because the same data helped define the classes and the uncertainty is ignored. The analysis should state whether the trajectory model is exploratory, whether class membership is treated as exposure, and how uncertainty and confounding are addressed.
A trajectory association is not a causal effect. If treatment influences class membership and later outcome, comparing classes may condition on a post-treatment variable and create selection bias. Causal questions require a target estimand, a time-varying treatment framework, and assumptions appropriate to the data-generating process.
Reporting requirements and reproducibility
A reproducible report should provide the time origin, measurement schedule, outcome distribution, link function, missing-data handling, class-specific trajectory form, random-effects structure when applicable, estimation method, starting values, convergence information, class enumeration results, posterior probabilities, and sensitivity analyses.
Plots should show raw or summarized observations together with fitted class trajectories and uncertainty. A plot of only the smooth class means can make a weakly supported solution look definitive. Include class sizes, uncertainty, and the observed follow-up range. If curves are shown beyond the observed time range, label that region as extrapolation and avoid implying direct data support.
Five-step latent trajectory workflow
| Step | Action | Output |
|---|---|---|
| Step 1: Define the longitudinal question | Specify the population, time origin, repeated outcome, follow-up window, and whether the aim is description, prediction, or causal analysis. | Pre-specified trajectory estimand and data map |
| Step 2: Build the measurement model | Choose the outcome distribution, link, time scale, plausible trajectory shapes, and missing-data strategy. | Candidate model set with clinical rationale |
| Step 3: Enumerate classes transparently | Fit multiple class counts and starting values; inspect BIC, posterior probabilities, class size, convergence, and clinical plausibility. | Class-enumeration table and diagnostics |
| Step 4: Preserve uncertainty | Report posterior membership probabilities and use an uncertainty-aware procedure for predictors or downstream outcomes. | Probabilistic class summaries and uncertainty intervals |
| Step 5: Stress-test interpretation | Vary time shape, missingness assumptions, class count, and model specification; separate descriptive patterns from causal claims. | Robustness analysis and bounded clinical interpretation |
Evidence Summary Table
| Source | Evidence type | Main contribution | Reporting implication |
|---|---|---|---|
| Nguena Nguefack et al., Clinical Epidemiology | Open-access narrative methods review | Compared GMM, GBTM, LCA, LTA, clustering, and sequence analysis for epidemiological research. | Use precise terminology and match the method to outcome type and research question. |
| Nagin and Odgers, Group-Based Trajectory Modeling in Clinical Research | Clinical methods review | Provided a nontechnical overview of group-based trajectory and growth mixture models. | Report model construction, class interpretation, and uncertainty rather than only displaying curves. |
| Recent Advances in Group-Based Trajectory Modeling | Recent methodological update | Summarized developments in trajectory specification, estimation, and application. | Justify class enumeration and assess stability across plausible specifications. |
| Latent Class Analysis reporting guidance | Methods and reporting literature | Highlighted the need for transparent indicator selection, class enumeration, and interpretation. | Make model decisions and probabilistic membership visible to readers. |
| FDA / ICH context | Regulatory and estimand context | Trajectory classes may support exploratory characterization, but they do not replace a pre-specified estimand or confirmatory endpoint strategy. | Separate exploratory subgroup discovery from regulatory causal or confirmatory claims. |
Researcher’s Toolkit
Move from longitudinal data to defensible interpretation
Use Lingcore SCI tools to keep trajectory modeling connected to the broader research workflow:
- Paper Analyzer: audit whether a trajectory study reports class enumeration, posterior uncertainty, missing-data assumptions, and downstream analysis boundaries.
- Review Builder: organize verified literature on GBTM, GMM, LTA, missing longitudinal data, and reporting standards.
- Journal Matcher: compare journals suited to longitudinal methods, epidemiology, biostatistics, and clinical prediction research.
Conclusion
Latent class trajectory models can make clinically important longitudinal heterogeneity visible. Their value depends on disciplined specification and restrained interpretation. Researchers should distinguish GBTM from GMM and related approaches, align the outcome distribution and time scale with the clinical process, evaluate several class solutions, report posterior uncertainty, address missingness and informative observation, and avoid treating latent classes as observed diseases. A trajectory model is strongest when it clarifies a pre-specified longitudinal question and remains explicit about what the data identify and what still depends on modeling assumptions.
© 2026 Lingcore Health SCI. Not affiliated with any medical institution. For research purposes only. This article is methodological information, not clinical advice or a treatment recommendation.