Bland–Altman Agreement Analysis in Clinical Measurement
Bland–Altman analysis evaluates whether two quantitative measurement methods agree closely enough for a defined clinical use by estimating mean bias and limits of agreement; it does not replace clinical acceptance criteria and it is not a test of correlation.
Clinical researchers often compare a new instrument, laboratory assay, imaging algorithm, or bedside measurement with an established method. The tempting first step is to calculate Pearson’s correlation or fit a regression line. Those analyses describe association, not whether two methods produce values close enough to be used interchangeably. Bland–Altman agreement analysis focuses on paired differences, their average magnitude, and whether the observed disagreement is acceptable for the intended decision.
Agreement is different from association
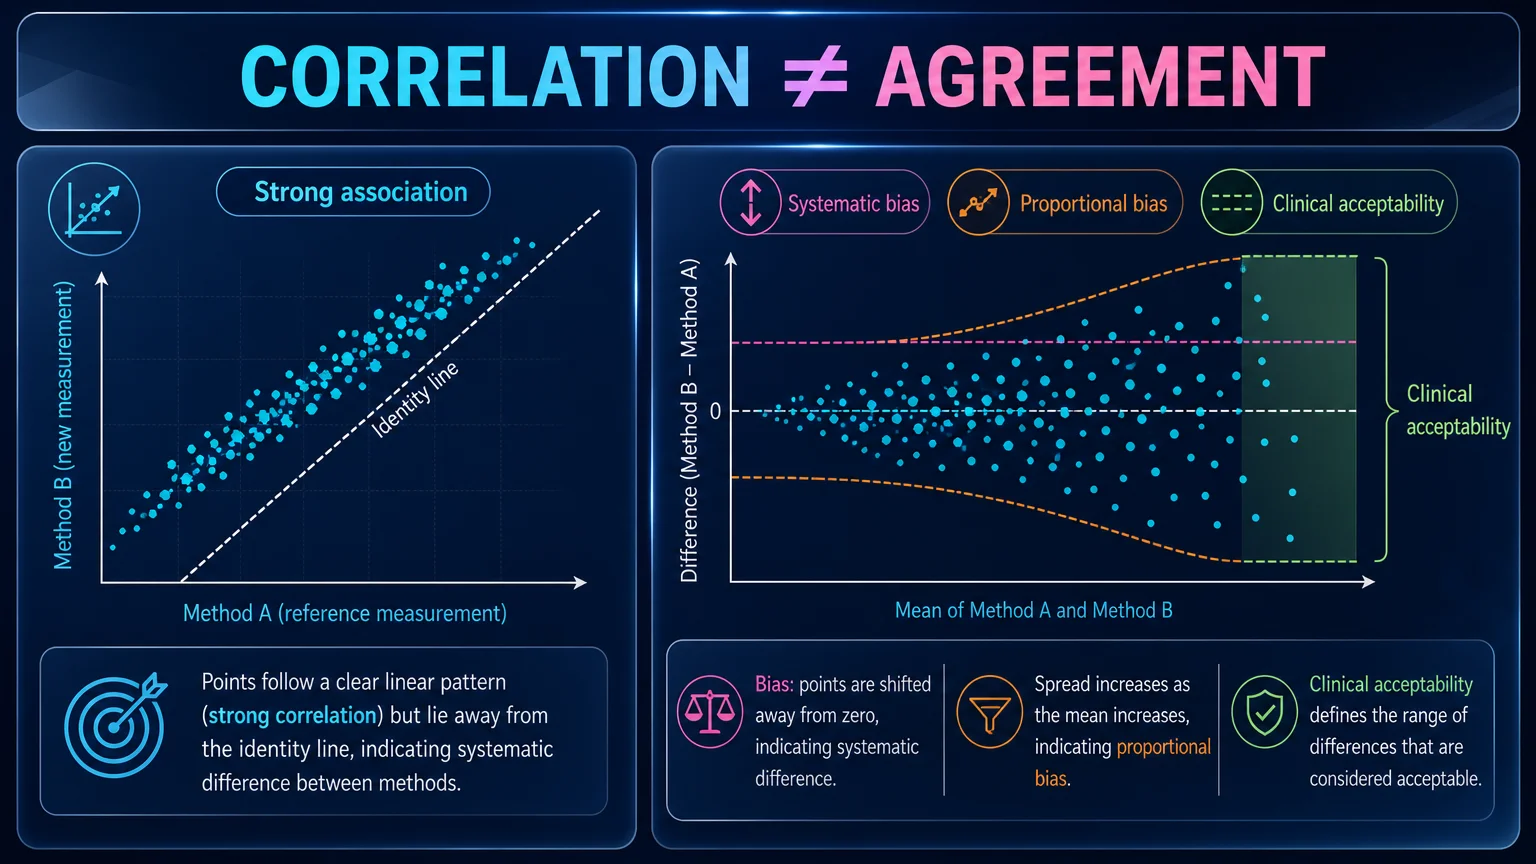
Suppose method A and method B measure the same physiological quantity. If every value from method B is consistently higher than the corresponding value from method A, the two methods may be strongly correlated while still being clinically non-interchangeable. A correlation coefficient can be close to one because the measurements rise and fall together, even when their differences are large enough to alter treatment or eligibility decisions.
Regression has a related limitation. A slope and intercept can reveal proportional or constant differences, but a good fitted line does not directly quantify the range of disagreement expected for an individual measurement. Method comparison requires a question about individual-level differences: if the new method replaces the comparator, how far could its value reasonably depart from the comparator for a future patient?
| Analysis | Main question | Why it is insufficient alone for agreement |
|---|---|---|
| Correlation | Do the two methods vary together? | It measures association and is affected by the range of measurements; it does not quantify clinically acceptable disagreement. |
| Linear regression | Can one measurement be predicted from the other? | Average prediction and fitted trends do not describe the full distribution of individual differences. |
| Bland–Altman analysis | What is the bias and what range of differences should be expected? | It still requires prespecified clinical acceptance limits; statistical limits do not decide clinical interchangeability. |
| Concordance or reliability metrics | How consistently do measurements rank or repeat? | Reliability and agreement address related but distinct properties and should match the study question. |
How the Bland–Altman plot is constructed
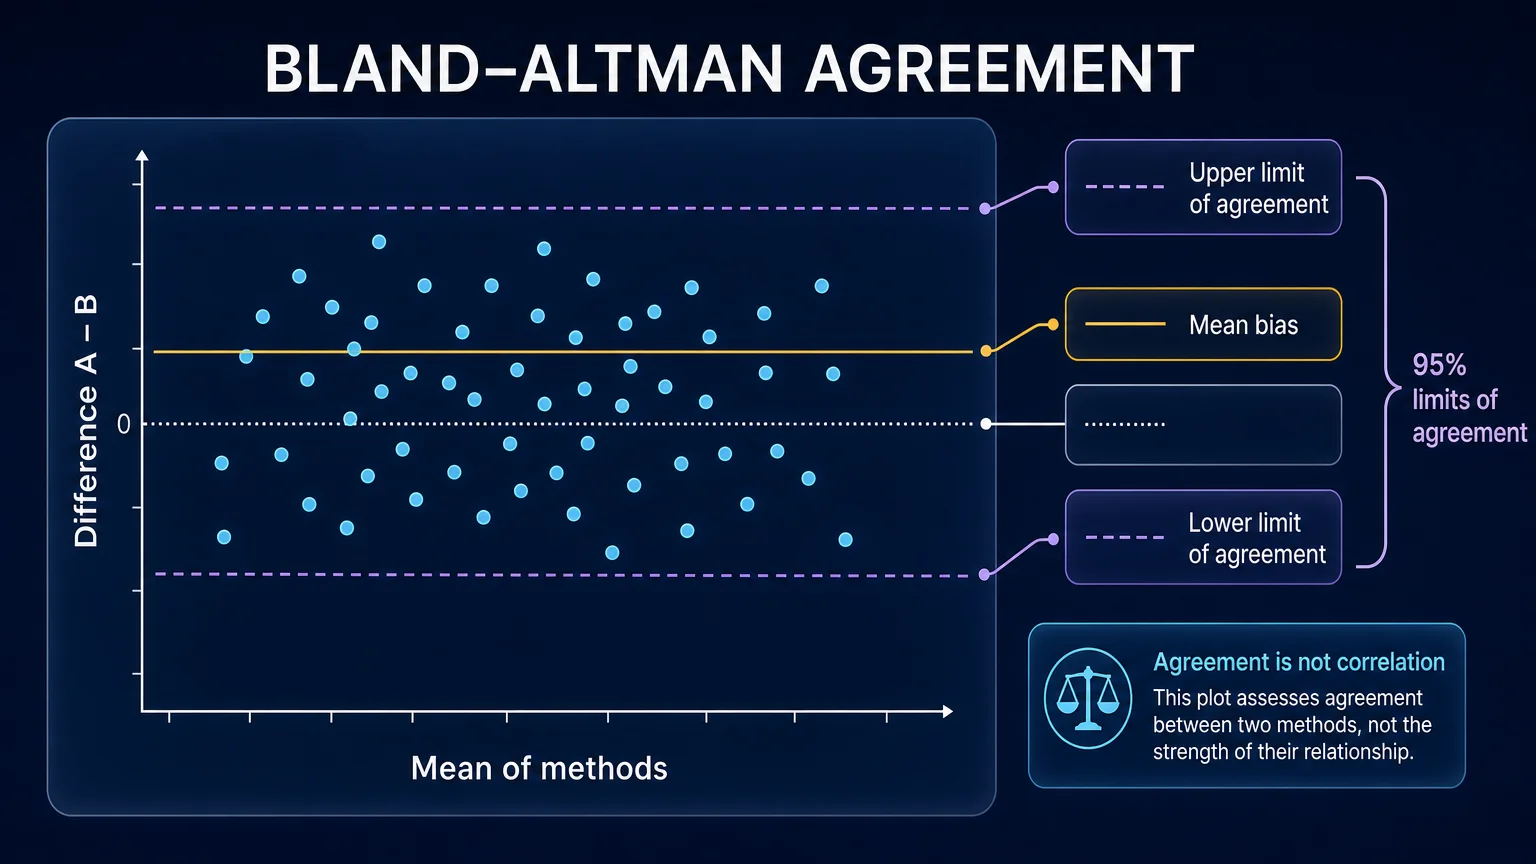
For each paired observation, calculate the difference between methods and the average of the two methods. If method A is the index method and method B is the comparator, define the difference as di = Ai − Bi and the mean as mi = (Ai + Bi)/2. Plot each difference against its corresponding mean. The horizontal axis represents measurement magnitude; the vertical axis represents disagreement.
The mean difference estimates average bias. A positive bias indicates that method A tends to produce higher values than method B under the chosen direction; reversing the subtraction reverses the sign but not the underlying disagreement. The standard limits-of-agreement calculation uses the mean difference plus or minus approximately 1.96 standard deviations of the differences when the distributional assumptions are reasonable. These limits describe the interval expected to contain most individual differences, not a confidence interval for the mean bias.
Three visual features matter. First, a cloud displaced from zero suggests systematic bias. Second, a trend in the differences across the mean suggests proportional bias. Third, a fan-shaped spread suggests that variability changes with measurement magnitude. A single pair of constant-scale limits may be misleading when heteroscedasticity is substantial.
Define the measurand and intended use before calculating limits
A defensible method-comparison study starts with the quantity being measured and the decision that depends on it. “Agreement” is not a universal property of an instrument pair. A difference that is negligible for exploratory screening may be unacceptable when a value determines medication titration, transfusion, escalation of care, or trial eligibility.
Specify the target population, sampling conditions, measurement units, timing, and whether the comparator is a reference method or simply another imperfect method. Both methods should be applied to the same specimen, participant, or imaging episode under comparable conditions. If measurements are taken at different times, changes in the underlying state can be mistaken for method disagreement.
Prespecify an acceptable difference or an acceptance rule. The rule may be expressed in absolute units, a percentage, a clinically meaningful change, or a decision-specific threshold. If acceptance limits are unavailable, the study can still estimate bias and statistical limits, but it should not claim interchangeability merely because most points lie within the plotted band.
Diagnose bias and non-constant variability
Mean bias can conceal important patterns. A new assay may agree at low concentrations but diverge at high concentrations. An automated image measurement may have larger errors for larger lesions. A wearable sensor may show different agreement during motion than at rest. Plotting differences against means helps reveal these patterns, but formal modelling may be needed when the visual signal is complex or repeated observations are present.
When variability increases with magnitude, consider a scale transformation or a ratio or percentage-difference analysis if scientifically justified. Log transformation can make multiplicative error easier to interpret, but it changes the estimand and requires careful back-transformation. Reporting only transformed limits without explaining their clinical meaning can make the result difficult to use.
Outliers deserve investigation, not automatic deletion. A point may reflect a data-entry error, device failure, protocol violation, or a true clinically important disagreement. Report prespecified exclusion rules, the number of excluded pairs, and a sensitivity analysis when exclusions could change the conclusion. Bland–Altman plots are diagnostic tools; they do not turn an unexamined outlier into a statistical nuisance.
Repeated measurements require dependence-aware analysis
The simple formula assumes one independent pair per subject. Clinical studies frequently collect multiple measurements per participant, multiple raters, multiple body sites, or repeated device readings. Treating all pairs as independent can underestimate uncertainty and produce limits that do not reflect between-person and within-person variation.
For repeated measurements, consider mixed-effects or hierarchical agreement models, subject-level resampling, or repeated-measures extensions that estimate within-subject agreement. The analysis should distinguish repeatability of one method from agreement between two methods. A method can be highly repeatable yet systematically disagree with the comparator; two methods can have similar average values while showing poor repeatability in individuals.
The data structure should be reported explicitly: number of participants, number of pairs per participant, order of methods, blinding or randomization of measurement order, replicate design, and whether analysts knew prior measurements. A transparent flow of included pairs and exclusions is as important as the final plot.
Confidence intervals and precision
Point estimates of bias and limits of agreement are not enough. The mean bias has sampling uncertainty, and the upper and lower limits also have uncertainty. Confidence intervals can be obtained using analytical methods under appropriate assumptions or by bootstrap procedures that resample at the participant level when observations are clustered.
Sample size should be justified by the precision needed for bias and agreement limits, not by a generic correlation power calculation. A study may have enough observations to estimate a high correlation but not enough to characterize the tails of the difference distribution with useful precision. The intended acceptance rule, expected variability, number of repeated measures, and target confidence-interval width should inform planning.
| Reporting item | Minimum information | Reason |
|---|---|---|
| Paired design | Population, setting, sampling range, measurement order, and timing. | Agreement depends on the population and measurement conditions. |
| Difference definition | Which method was subtracted from which and the measurement units. | Bias direction and interpretation depend on the subtraction order. |
| Bias | Mean difference with uncertainty interval. | Shows systematic average disagreement and estimation precision. |
| Limits of agreement | Formula, assumptions, estimated limits, and uncertainty intervals. | Shows expected individual differences rather than only average behaviour. |
| Pattern assessment | Difference-versus-mean plot, proportional bias, heteroscedasticity, and outlier handling. | Constant limits may be inappropriate when disagreement varies with magnitude. |
| Clinical criterion | Prespecified acceptable difference and decision rule. | Statistical agreement does not determine clinical interchangeability. |
Seven-step Bland–Altman workflow
| Step | Action | Deliverable |
|---|---|---|
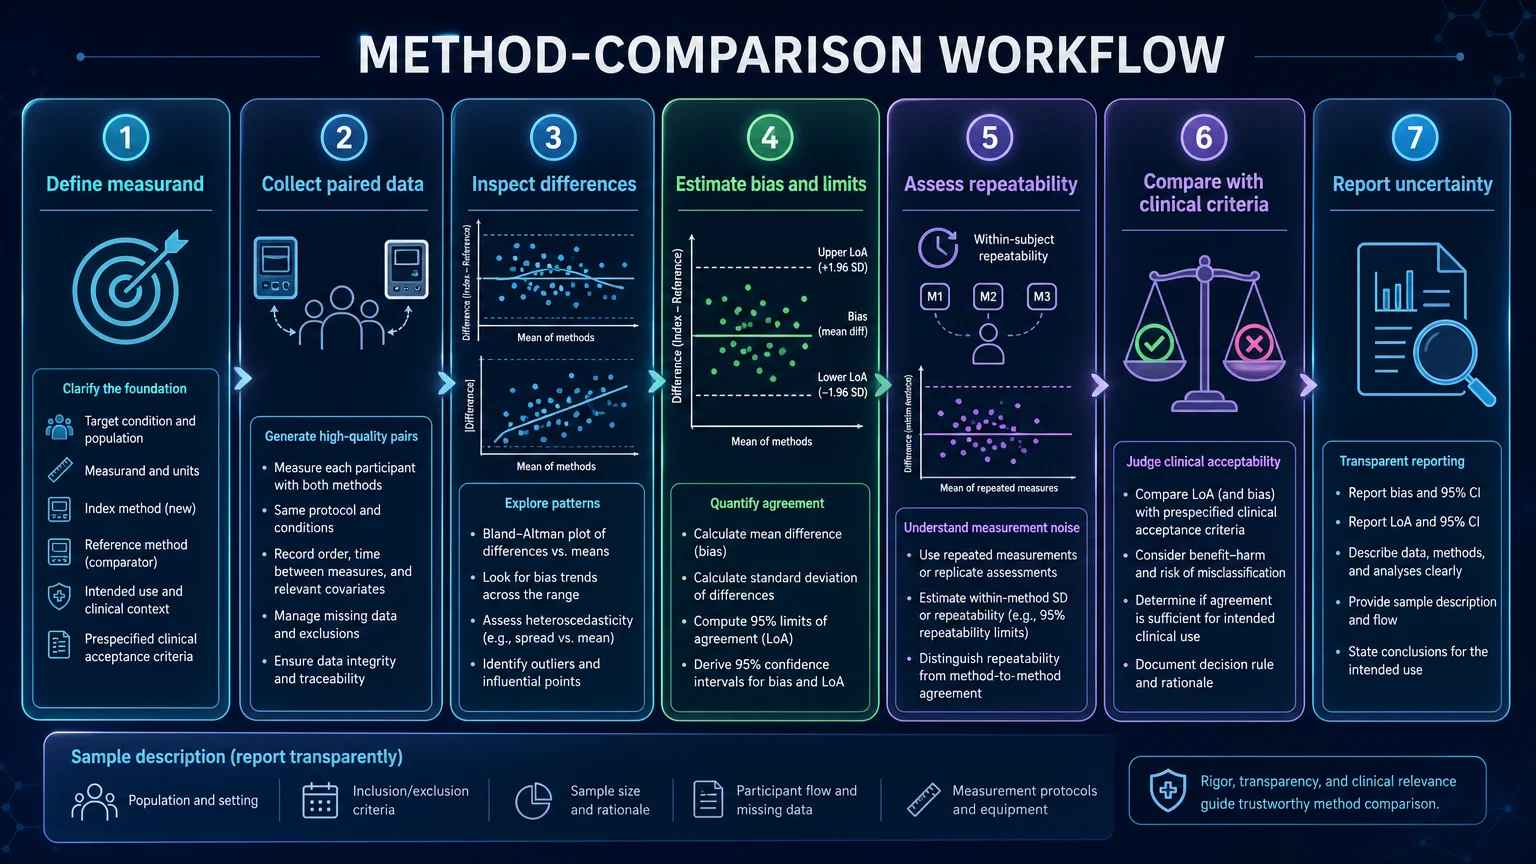
| Step 1: Define the measurand | State what is being measured, for whom, under which conditions, and how the value will be used. | Versioned measurement and intended-use specification. |
| Step 2: Collect paired data | Apply both methods to the same units with standardized timing and traceable quality control. | Paired dataset with participant and protocol metadata. |
| Step 3: Inspect differences | Plot differences against means, examine distribution, trends, outliers, and changing spread. | Diagnostic agreement plots and data-quality log. |
| Step 4: Estimate bias and limits | Calculate mean difference, standard deviation, limits of agreement, and confidence intervals using the appropriate design. | Bias and agreement estimates with uncertainty. |
| Step 5: Assess repeatability | Use repeated observations or hierarchical methods when the design includes within-subject replication. | Repeatability and method-to-method agreement components. |
| Step 6: Compare with clinical criteria | Judge the estimated differences against acceptance limits defined before reviewing the result. | Clinical acceptability decision and rationale. |
| Step 7: Report uncertainty | Describe sample flow, exclusions, assumptions, confidence intervals, and limitations in the intended population. | Reproducible method-comparison report. |
Evidence Summary Table
| Source | Evidence role | Practical contribution |
|---|---|---|
| Giavarina, Biochem Med 2015 | Clinical guidance review | Explains why correlation is not agreement and how to construct and interpret difference-versus-mean plots. |
| Bland & Altman, Stat Methods Med Res 1999 | Foundational method-comparison paper | Describes limits of agreement and the interpretation of expected individual differences. |
| Bland–Altman methods review, 2023 | Modern methodological review | Discusses method-comparison choices, repeated measurements, transformations, and extensions. |
| Biochemia Medica method guidance | Reporting and interpretation resource | Emphasizes that acceptable limits must be defined from clinical or analytical requirements. |
| EQUATOR Network | Reporting-resource hub | Supports transparent reporting and selection of design-appropriate guidance for biomedical measurement studies. |
Common reporting errors
- Calling two methods interchangeable because the correlation coefficient is high.
- Reporting statistical limits of agreement without stating whether they are clinically acceptable.
- Failing to define the subtraction direction, measurement units, or intended-use population.
- Using ordinary limits-of-agreement formulas for repeated observations without accounting for clustering.
- Ignoring proportional bias or increasing spread across the measurement range.
- Removing outliers after seeing the plot without a prespecified rule or sensitivity analysis.
- Reporting a plot without confidence intervals, sample flow, repeatability information, or measurement conditions.
Researcher’s Toolkit
Use Lingcore SCI tools to connect agreement analysis with rigorous publication workflows:
- Paper Analyzer: audit Bland–Altman calculations, repeated-measure assumptions, bias interpretation, and clinical acceptance claims.
- Review Builder: organize evidence on method comparison, repeatability, agreement limits, and measurement-error reporting with traceable citations.
- Journal Matcher: identify journals aligned with laboratory medicine, diagnostic methods, clinical measurement, and biostatistics.
Conclusion
Bland–Altman analysis answers a practical method-comparison question: how large are the differences between two measurements, and are those differences acceptable for the intended clinical use? The analysis is strongest when the measurand, population, paired design, difference direction, acceptance rule, and uncertainty plan are specified before the plot is interpreted. Correlation and regression can describe association or systematic trends, but they do not replace agreement analysis. For repeated measurements or non-constant variability, the design requires extensions that reflect clustering and scale. Transparent reporting turns a familiar plot into a defensible measurement-evidence argument.